Design + Cartography = 

Maps are a generally a graphic representation of geography. Similarly, diagrams extend further to portray a succession of items, events, or parts of a larger whole. Diagrams are used to define and communicate an agenda– to aid in understanding the characteristics and complexities of something. If the diagram is intended to help other people, then the information must be formatted clear or else the potential is diminished to the point of causing more confusion. Some of the most helpful diagrams that managers and designers use are; 

  • Association Map                • Block Diagram
  • Flow Diagram                     • Gantt Chart
  • Hierarchical Map                 • Journey Map
  • Quadrant                             • Schematic / Exploded Schematic
  • Swim Lane                           • Venn Diagram

For thesis class, I wanted to better understand the relationships between my projects in terms of the class assignment, the target audience(s), the deliverable, and the value proposition. For internal clarity, what are the connections, disparities, and overlaps in the landscape of my thesis? 

Diagram: pre-lecture 

As a concept, diagrams are not pretty illustrations. They help us connect with an audience in ways that words can't achieve–especially helpful when working with groups to reach a consensus. There are the key do's and don't's that arose from Abby's presentation on how to make effective diagrams;

  1. Architect before design– plan the landscape before planting greenery
  2. This is not a pretty picture/ illustration 
  3. Avoid 'rainbow worship'– the overuse of color coding can be confusing and distracting
  4. Identify your user and context
  5. Labels matter– take care when selecting what labels to use
  6. Be careful when using icons over labels– are icons necessary, clear, and appropriate?
  7. Avoid Jargon– know the audience and the proper terminology, simple is better
  8. Avoid unnecessary exactitude with numbers (i.e. 1.6180339887% vs. 1.6)
  9. Avoid crossing lines and stacking letters– keep the layout neat and tidy (see #2)
  10. Be careful when using graphic design elements like gradation, contrast, and line weight
  11. Try to avoid hyphens and line breaks
  12. Do the research 
  13. Get feedback from others when you think the diagram is complete
  14. Iterate the diagram based on feedback (repeat #13)

After the presentation and class feedback, I remade the diagram shown above in favor of a gantt diagram. Managing my time versus task load is by far the most difficult part of grad school so mapping the projects versus time would be more beneficial. My inclination to hyper-focus has been a disruption and therefore I struggle with what's being called 'switch fatigue'– interruptions cause a stress response that releases cortisol and the thoughtful-reasoning part of the brain is put to rest. When tasks on the gantt chart are completed, it feels good! 

Gantt diagram on a 3 foot wide spool of paper. 

Gantt diagram on a 3 foot wide spool of paper. 

Ontology : Controlled Vocabulary

Yesterday, Nicole Fenton joined our class to speak about controlled vocabulary and the relationship between a writer and editor. Nicole is a writer, editor, and content strategist. She hosts workshops and works with nice people on websites and publishing projects.

As we prepare a 24,000 word (50 page) thesis book, the search to hire an editor has begun. We discussed project budget, pricing structure, rounds of edits, and deadlines. 

The most important takeaway was making sure my that written work is clear and able to be understood by a non-academic audience–overly technical jargon can be reduced or made clear with the controlled vocabulary section of our final thesis book. This is tough for me because the Products of Design program is teaching us to embrace and use  the language that is currently circulated in the design field. Knowing your audience for any output is the tact and skill that I am here to learn be it a blog post, a thesis book, or a presentation to colleagues. 

Thanks to Abby and Nicole for the guidance!


ASSIGNMENT #3 (Thesis 2 Class)

This exercise seeks to realize the intention of my thesis by establishing meaning. A performance continuum is used to map my intent towards a goal and relative to the thesis defense presentation from December. I began by creating juxtaposing the following attributes and ranking them based on how much they mean to my thesis goal.  

CONSTELLATION MAP

CONSTELLATION MAP

Afterwards, I listed four attributes at the core to my thesis, which were brought up during the team exercise today in class, and ranked their proximity. 

continuum.jpg

This two year Products of Design MFA degree is inherently a personal transformation or journey– from my roots as an ornamental and architectural metalsmith– but the intent of my thesis is to exhibit my strengths and weaknesses as a designer so that after graduating, I will be suitably employed in a new career as a designer. 

ASSIGNMENT #2 (Thesis 2 Class)

In order to be more specific about my intended audience and market, I will be defining a user group by creating 3-5 user personas and targeting those personas for the next round of user interviews to develop my thesis further. 

Previously, I built an app that more or less sought to illustrate ‘true cost’ economics. The value of a purchase were posed in terms of the relationship between money spent to purchase an item and the time it take us to earn the money. As metaphysical as this may sound, it was a simply formatted as a choose-your-own-adventure game with three major branches. My intended user for this intervention interaction was, just like Sly Stone sings, “everyday people.” 

I was fortunate to have gleaned some key insights from the ‘everyone’ approach which seeded me towards who to approach for the next round of interviews. One man mentioned that he thinks of spending money on himself in terms of how much overtime he would have to work. His non-overtime pay, regular hours worked, is accounted for in providing for his family. A woman in her late 20’s attributed her careful spending of money on non-necessities to the teachings from her parents and religion. She takes a photo of what she desires to buy and if she sees is a few days later and still wants the item, then she considers buying it. A man in his early 30’s mentioned right away that he already thinks of money in like this, in terms of hours worked. When I asked how he has come to a similar approach to financial decisions, he said it because as a worker in the gig-economy, you kind of have to do this. One man is a fine artist and did not at all think of money in terms of time except that he worked to get the next commission or grant that, as a large chunk of money, would allow him to continue making his art– value was not in the dollar but in continuing his body of work. 

To expand my information base, I have selected freelance workers and college students as two personas to interview, which will then be split into those with and without children or families.  

Even if gig-workers may seem to understand money in different, tangental terms, I will interview people at WeWork sites to hear how freelance workers manage to save for retirement or to save for income taxes.

The campus of NYU would be another site to interview college students close to completing their BFA or MFA degree. This audience is relevant as they would be close to beginning their career and in a prime position to think of saving money despite possibly having loans to begin paying off. 

The thirds audience or user will be someone at a financial institution– their role being to set up accounts for new users or in consulting people how to manage their money. This user may be found at a bank or a financial advisor that, for instance, manages 401K plans.

Before interviews begin, I will familiarize myself with the digital tools that exist to help people save for retirement, add to their savings account, or to control impulse purchasing. I want to know how people learned to take control of their finances (if they have or not), what events or emergencies derailed their savings, how long have they been saving, what incentives or motivations are there to save for the future, and what tools or techniques they utilize.

POSITION: Hi, I’m conducting researching for my thesis– investigating the personal finances of ______(fill in with persona) from a non-bias position to understand what does and doesn’t work for people. There is no right or wrong answer and I am not to judge your beliefs, habits, expenses, what you buy nor how much you make. You are free to give as much information as your comfortable with. Would you be willing to talk for 15 minutes perhaps I can buy you a coffee. . . . . 

CONVICTIONS: Understand what they believe to be true and why. How did they learn or start doing this, how is it currently going?  

DOUBTS: What event or emergency could threaten your future financial security? What are the factors in your control and what are out of your control? 

QUESTIONS:

1) Do they have a credit card? Roughly estimate the balance due in terms of your monthly rent– how many months worth or rent is the balance? 

2) Do they have a savings account? How much money in savings do you consider to be adequate? 

3) Do you have a retirement plan? If so, what type (Roth IRA, Traditional IRA, 401K)? How many years have you been contributing to it? Does your employer match your investment? 

4) How do you track spending versus income? Mentally, an app, online tools etc. 

5) What’s an example of a big ticket purchase you made and how do you navigate buying it? Decisions, cause and effect, timing, cost to others or yourself. 

6) Do you have dependents like family, friends, spouse, partner, or children that you account for in your finances? 

7) peripheral questions: Do you believe that human activity causes climate change? 

Consumption Conversion :

NCR teams with Maine FI to fine-tune Alexa's financial skills

On October 5, 2017, NRC Corp. announced its partnership with Maine-based Town & Country Federal Credit Union to create a new skill for Amazon Alexa-enabled devices that allows consumers to securely link and manage their personal bank account information through the device. 

"[W]e are excited to be the first credit union and among the first banks in the country to introduce a skill for Alexa with bank account linking, and to help lead the way for others in the financial services industry to explore this new technology," Town & Country President and CEO David Libby said in the release.

"[W]e are continually investing in cutting-edge technology delivering experiences like conversational banking that transform banking experience," said Eli Rosner, NCR senior vice president and chief technology officer for software solutions. "We help our partner financial institutions redefine the consumer experience in financial services, thus driving improved engagement and advocacy." (link to article)


Introducing a new partnership; 

Chris_Rand_thesis_GreenTime2.jpg

As a component to my thesis study, I am proposing the following hypothetical partnership called GreenTime as an incentive aimed at slowing down the consumption of merchandise to decrease the environmental strain on the planet and it's resources. 

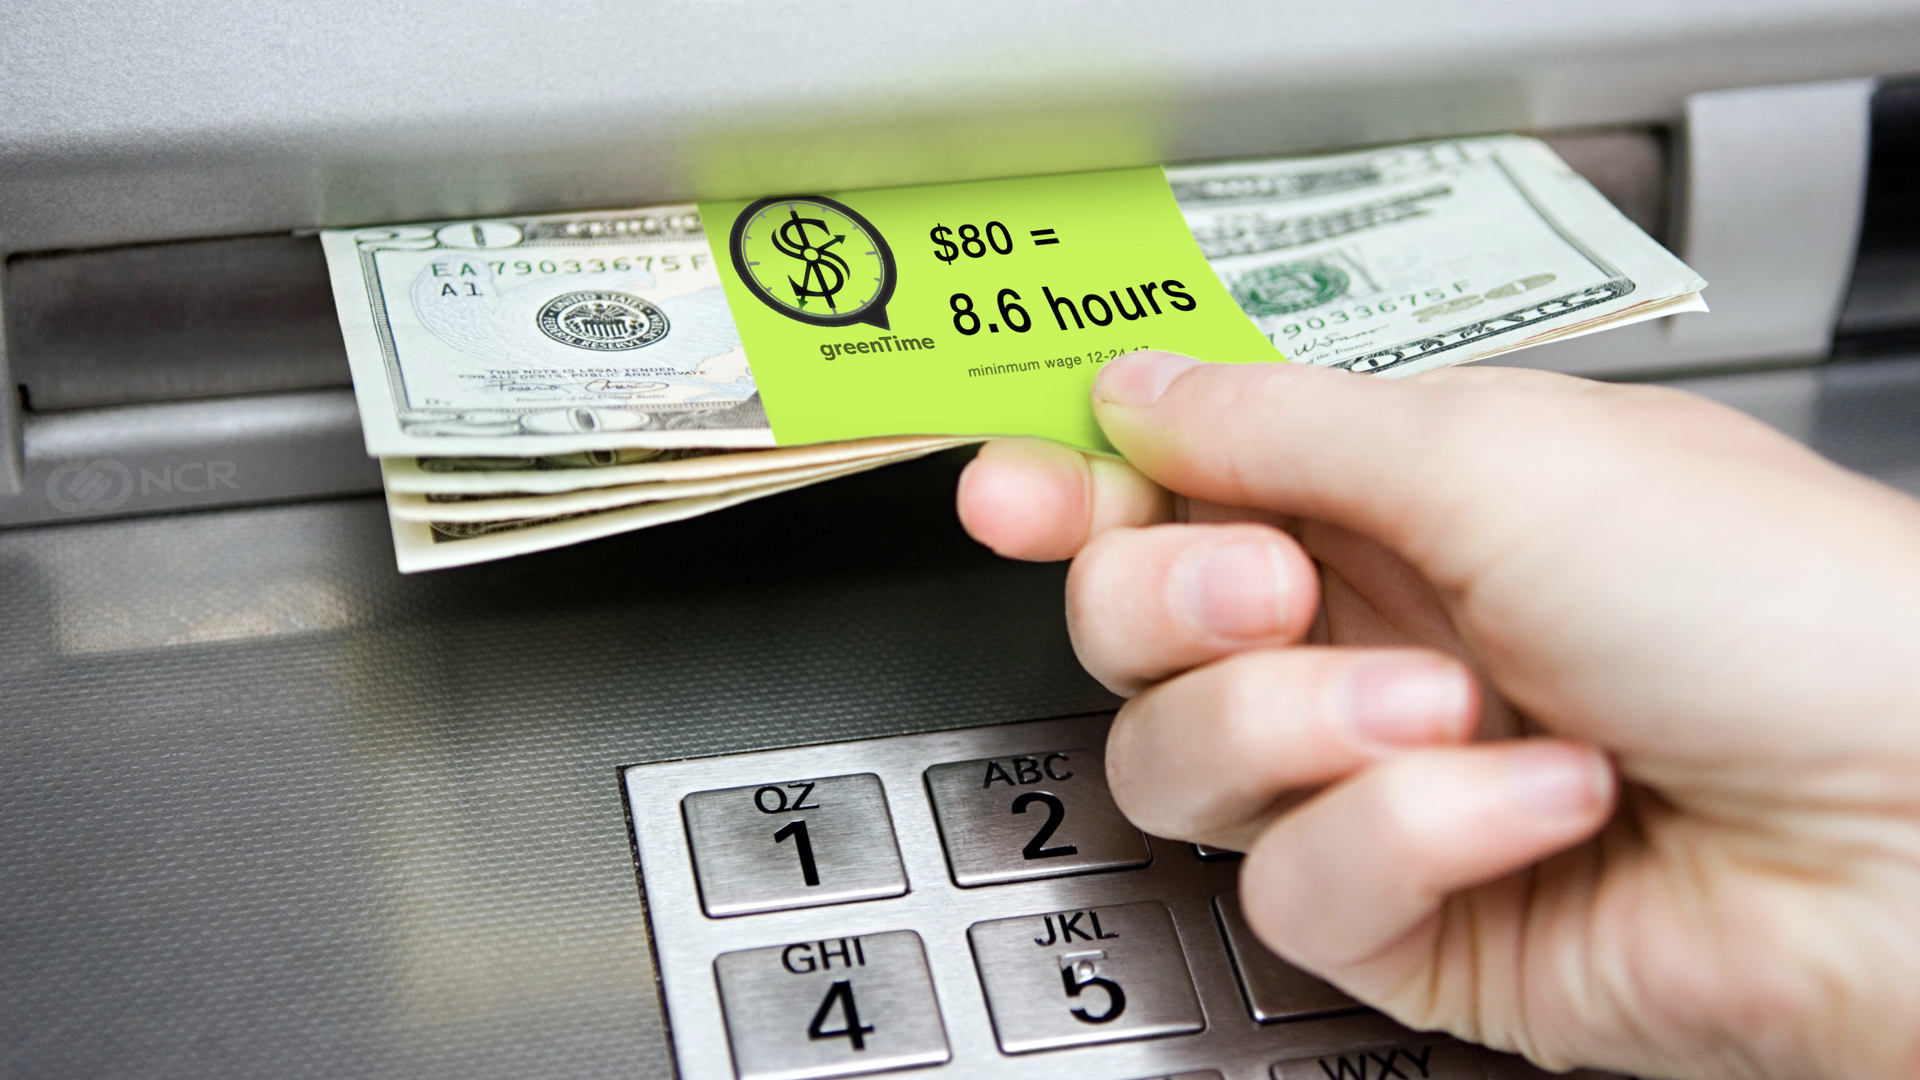
There is an ever growing disconnection between money and time. It's easier to spend money as we earn it than to save money for annual income taxes or even worse, for the distant future goal of retirement. I am proposing the following nudge / carrot / incentive– a reminder at two critical stages of interaction; the INPUT and OUTPUT phase of ATM's.

INPUT STAGE- when depositing monies, the screen offers two main choices for allocating the funds. 

INPUT STAGE- when depositing monies, the screen offers two main choices for allocating the funds– the Deposit Smart % option calculates your wages and displays the amount in terms of hours closer to retirement: 

Adding 6% of this deposit means you can retire 12 hours earlier

OUTPUT STAGE- when withdrawing cash, a note is provided not on a receipt that can be overlooked, but right where your hands and eye are most present.  

OUTPUT STAGE- when withdrawing cash, a sticky note is adhered to the cash. To mitigate being overlooked, this message does not only appear on the transaction receipt, but appear at the focal point of the eye and hand.


I was recently introduced to the poet and critic Ezra Pound and his discourse on economics through the writings of Lewis Hyde in his book The Gift. “Pound felt that as long as we are going to use money as a symbol of value, should be different kinds of money to stand for different kinds of value: clover money for clover and salt money for basalt.”

Hyde later discusses the rise of market value as THE form of value and how cash exchanges are rooted in logical and concrete thinking however, the image of cash exchange especially with credit, has been lost to layers of abstraction. We don’t speak clearly about money for what it is, “a ticket” rather we associate it with more symbolic exchange. And that's what I am trying to do right here- reconnect the symbolism of time and money. 


Let's Get Visual, Let's get Physical

When Olivia Newton John's hit song "Physical" made its debuted in the 1980's, you could readily find images of food and beverages compared to a stack of sugar cubes. Although these visuals are compelling, sugar cubes were like lego bricks to me rather than tangible signifiers of how much sugar I was consuming.  It is shocking to find these images are at the top of my search results over three decades later. 

11_ChrisRand_Nuance_9.27.17.004.jpg

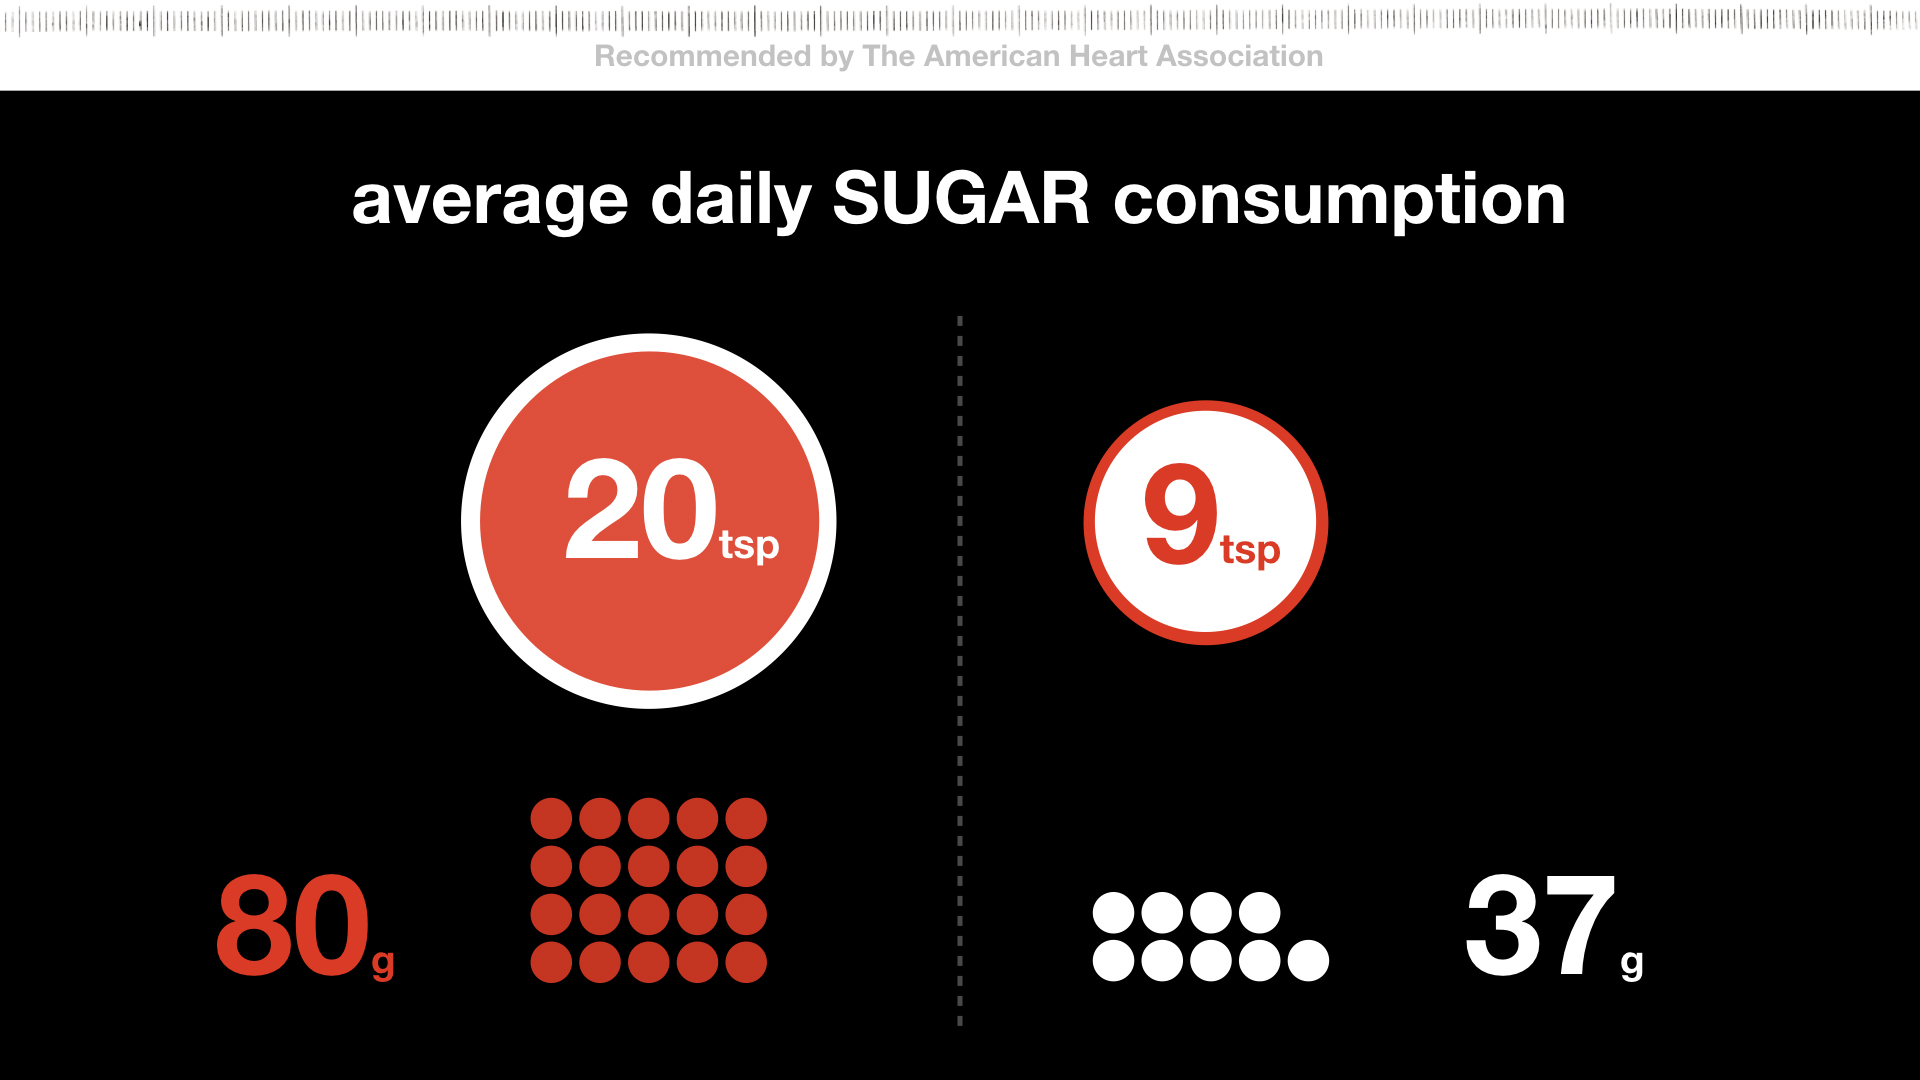
Designers often use other methods for data visualization to emphasize relationships in graphical formats. Like the infographic I made below, the numeric values are emphasized by spacial relationship and size of circles.  But have we missed out on other formats that are more universal, tangible, modern, or effective? 

11_ChrisRand_Nuance_9.27.17.005.jpg

≈ 44% of the global population use a smartphone- that's 2.32 billion people

Let's harness the ubiquitous and personal relationship we have with a smartphone and leverage it to convey the recommended and actual consumption of sugar. After all, our hands and mind are intimately aware of this modern signifier. 

CONVERSION BASED ON VOLUME

CONVERSION BASED ON VOLUME

CONVERSION BASED ON VOLUME

CONVERSION BASED ON VOLUME

CONVERSION BASED ON VOLUME

CONVERSION BASED ON VOLUME

It's all about relativity!

From a young child to an adult, the smartphone is more real than a stack of sugar cubes, a teaspoon, or that illusive measurement of grams or milligrams. Let's make the units that signify our consumption more implicit, visceral, and tangible. Let's make it so people don't have to download an app or even click once to calculate, understand, or convert the percent daily value into to meaning.