When Olivia Newton John's hit song "Physical" made its debuted in the 1980's, you could readily find images of food and beverages compared to a stack of sugar cubes. Although these visuals are compelling, sugar cubes were like lego bricks to me rather than tangible signifiers of how much sugar I was consuming. It is shocking to find these images are at the top of my search results over three decades later.

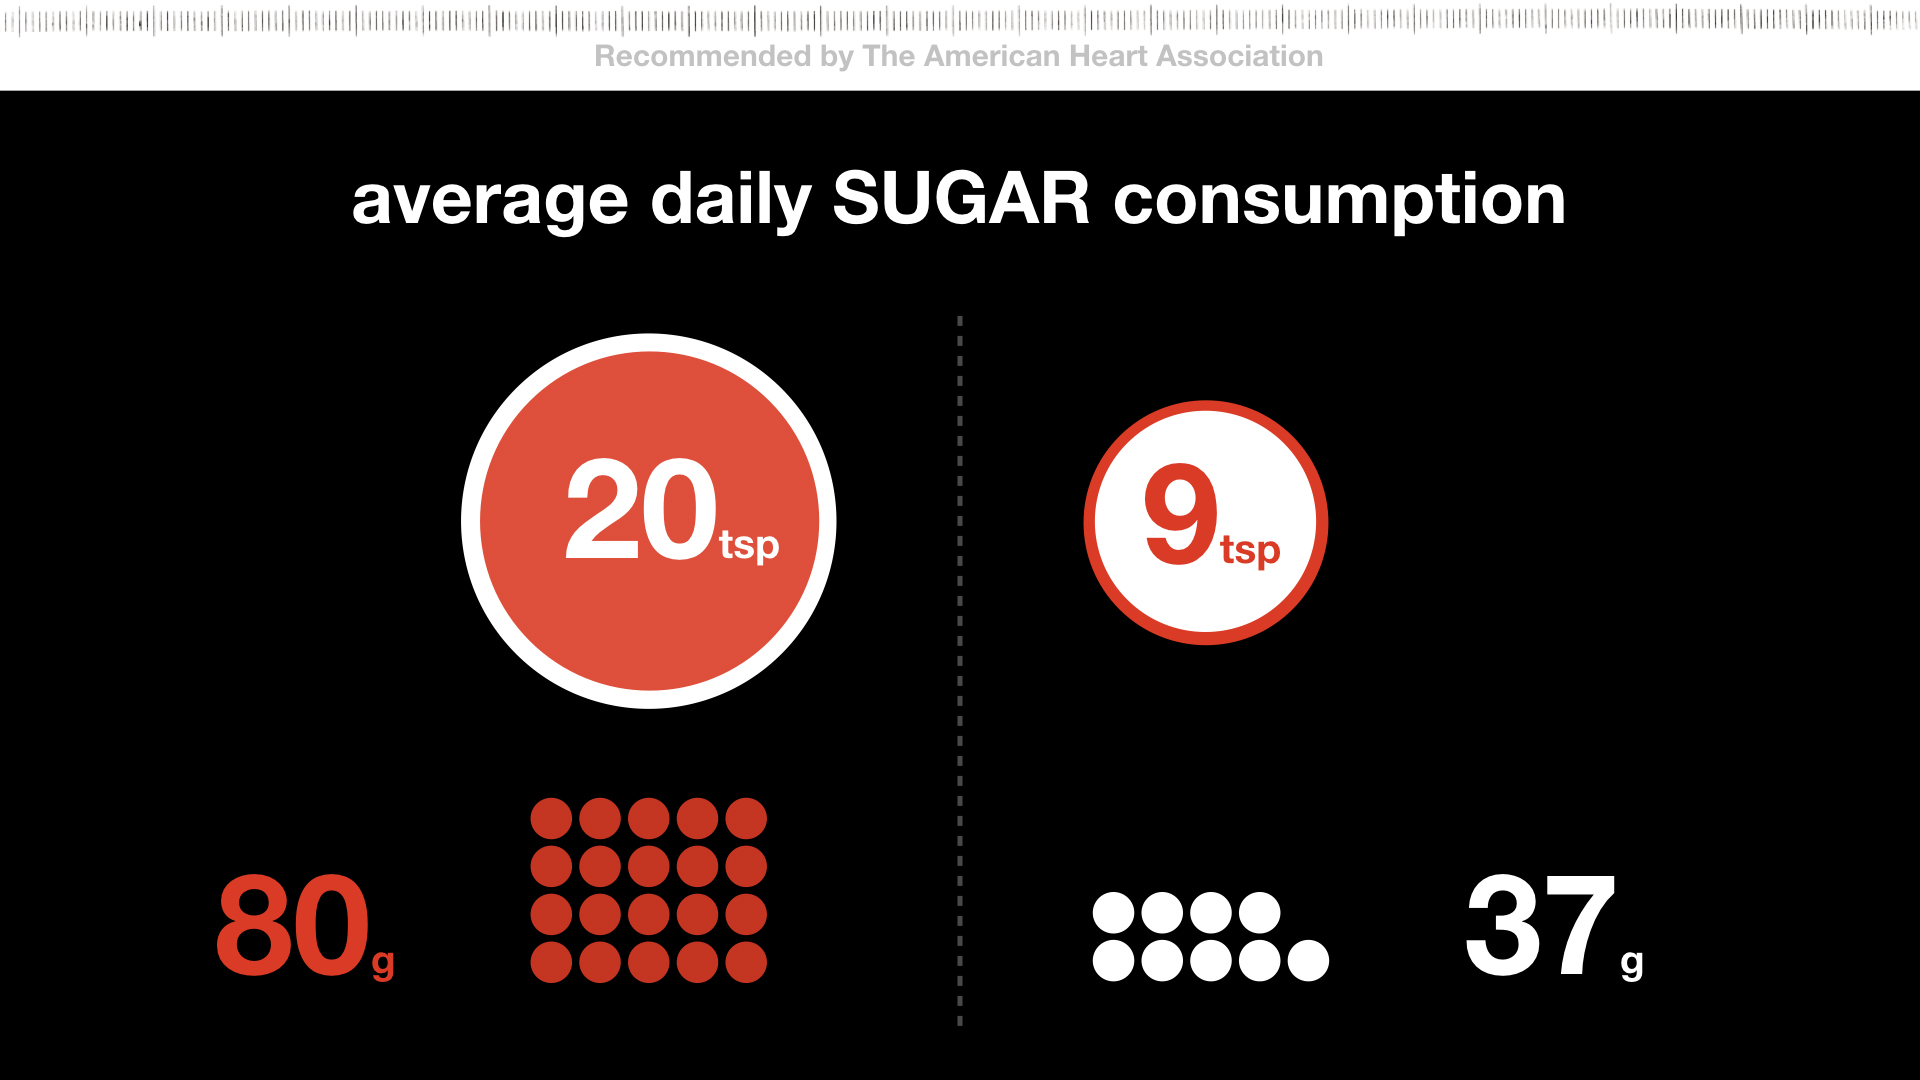
Designers often use other methods for data visualization to emphasize relationships in graphical formats. Like the infographic I made below, the numeric values are emphasized by spacial relationship and size of circles. But have we missed out on other formats that are more universal, tangible, modern, or effective?
≈ 44% of the global population use a smartphone- that's 2.32 billion people
Let's harness the ubiquitous and personal relationship we have with a smartphone and leverage it to convey the recommended and actual consumption of sugar. After all, our hands and mind are intimately aware of this modern signifier.

CONVERSION BASED ON VOLUME

CONVERSION BASED ON VOLUME

CONVERSION BASED ON VOLUME
It's all about relativity!
From a young child to an adult, the smartphone is more real than a stack of sugar cubes, a teaspoon, or that illusive measurement of grams or milligrams. Let's make the units that signify our consumption more implicit, visceral, and tangible. Let's make it so people don't have to download an app or even click once to calculate, understand, or convert the percent daily value into to meaning.